TRI-PHASEI-TECHAutomation Solutions of WI
How to Choose Automation Systems for Global Buyers in 2026?

How to Choose Automation Systems for Global Buyers in 2026?

Choosing automation systems for global buyers in 2026 requires more than comparing software features or machine prices. Buyers must examine production goals, workforce skills, cybersecurity controls, energy use, and supplier support. A system that performs well in Shenzhen may struggle in São Paulo or Warsaw. Local technicians, language settings, spare parts, and data rules can change the real cost.

Bill Gates once wrote, “The first rule of any technology used in a business is that automation applied to an efficient operation will magnify the efficiency.” That principle remains practical. Automation cannot repair unclear workflows. It can make them faster, larger, and harder to control. Experienced buyers should map one complete process before approving a global rollout. Measure cycle time, error rates, maintenance delays, and operator training needs. Then test the system in a controlled facility.

Start small.

The strongest automation systems usually combine reliable hardware, flexible software, transparent analytics, and responsive service teams. Buyers should request documented integration standards, realistic performance data, and references from similar industries. They should also ask difficult questions about vendor lock-in, upgrade schedules, remote access, and failure recovery. These details often matter more than impressive demonstrations.

No checklist is perfect. I have seen buyers underestimate installation downtime and overestimate artificial intelligence. That mistake can be expensive. A careful decision balances measurable productivity with human judgment, regional requirements, and long-term resilience. This guide explores those choices for manufacturers, distributors, and technology leaders planning responsible automation investments across global markets in 2026.

How to Choose Automation Systems for Global Buyers in 2026?

Define 2026 Automation Needs Against 541,302 Global Robot Installations

How to Choose Automation Systems for Global Buyers in 2026?

The figure of 541,302 global robot installations shows how quickly automation is entering factories. It also creates pressure to buy too soon. A high installation number does not guarantee the right system for your process.

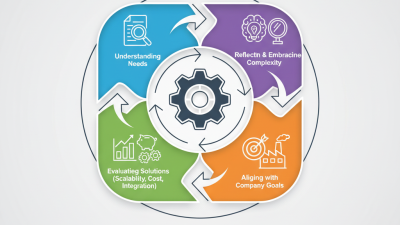
Start with measurable needs. Record cycle time, payload, reach, product variation, floor space, and operator interaction. A packaging line may need speed, while a machining cell may need repeatability and coolant resistance. Check the full workflow, not only the robot. Controllers, sensors, grippers, software, and safety equipment must communicate reliably.

Request documented test results, service response times, training plans, and spare-part availability in your region. These details often matter more than impressive demonstrations.

Tips: Run a small pilot with real materials and your busiest production shift. Measure downtime, changeover minutes, energy use, and rejected units. Ask whether technicians can troubleshoot the system without waiting for overseas support. Review local electrical, safety, and workplace requirements before signing. The cheapest quotation may become expensive after integration. A spreadsheet can still mislead. Include installation, programming, maintenance, and future expansion costs. Also question optimistic productivity claims. Your factory may have dust, unstable feeding, or frequent product changes. Those imperfect conditions should shape the final decision, not disappear from the proposal.

Compare PLC, PAC, and AI Architectures Using OEE and Cycle-Time Data

How to Choose Automation Systems for Global Buyers in 2026?

Global buyers should compare PLC, PAC, and AI architectures through measured production results. A PLC suits deterministic logic, stable sequences, and short response times. A PAC handles motion, process control, and larger data flows. AI adds prediction, anomaly detection, and adaptive optimization, but it depends on clean historical data. That dependency is often underestimated.

Use OEE and cycle-time data before approving a system. OEE combines availability, performance, and quality. Vorne’s OEE benchmark guidance places average manufacturing OEE near 60%, while world-class performance approaches 85%. A line producing 48-second cycles may look efficient, yet 60-second actual cycles reveal a major performance loss. The control architecture should expose that difference at machine level. Not just monthly totals. Data exposes the gap.

The 2024 Deloitte Smart Manufacturing Survey reported that 86% of manufacturing leaders expected smart manufacturing to remain a key competitiveness driver. Still, AI is not automatically the best choice. A PAC may deliver faster payback when cycle times are stable and downtime causes measurable losses. AI becomes more valuable when failures are irregular, quality signals are complex, or maintenance teams need earlier warnings. Buyers should test one production cell, compare baseline OEE with post-deployment results, and record false alerts. Perfect forecasts rarely survive the factory floor.

How to Choose Automation Systems for Global Buyers in 2026?

PLC, PAC, and AI-enhanced architectures compared using Overall Equipment Effectiveness (OEE) and average production cycle time. Higher OEE and shorter cycle time generally indicate better operational performance.

Reference scenario: discrete assembly cell operating across three shifts. OEE combines availability, performance, and quality; cycle time represents the average seconds required to complete one conforming unit. Values are representative operational benchmarks for architecture selection and should be validated with site-specific production data.

Verify Compliance with ISO 10218 and IEC 62443 for Global Deployment

Global automation buying now requires more than speed, uptime, and a low purchase price. The International Federation of Robotics reported 541,302 industrial robots installed worldwide in 2023. That scale increases safety and cybersecurity exposure. ISO 10218:2025 should guide robot-cell risk assessment, protective measures, emergency stops, and collaborative operating conditions. Buyers should request the supplier’s risk assessment, validation records, and operating limits before approval.

Cybersecurity needs equal attention. IEC 62443 provides a practical structure for secure industrial automation, including asset ownership, supplier responsibilities, secure development, and zone-based network design. The 2024 IBM X-Force Threat Intelligence Index identified manufacturing as the most attacked industry, accounting for 25.2% of observed incidents. A compliant-looking network is not automatically secure. Check unique credentials, patch procedures, remote-access controls, logging, and recovery tests. Ask who receives alerts at 2 a.m.

Tips: Build a compliance evidence pack before procurement. Include ISO 10218 documents, IEC 62443 alignment statements, network diagrams, software bills of materials, and test results. Verify the exact standard edition and applicable regional requirements. Interview the integrator’s safety engineer and cybersecurity lead. Test a stopped robot cell, a lost network connection, and a failed authentication attempt. Real evidence matters. A weakness remains possible, even after a successful factory acceptance test. Sources: International Federation of Robotics, World Robotics 2024; IBM, X-Force Threat Intelligence Index 2024.

Evaluate Connectivity Through OPC UA, MQTT, and 99.9% Uptime Targets

Global buyers should evaluate automation systems by how reliably they exchange data, not only by screen design or machine speed. OPC UA supports structured communication between controllers, sensors, and supervisory software. Its information models can preserve machine meaning, such as temperature, pressure, and alarm status. This reduces confusion when equipment comes from different suppliers.

MQTT offers a lighter method for sending data across factories, warehouses, and remote service networks. It works well when bandwidth is limited or connections briefly fail. Configure message quality levels carefully. A warehouse gateway may need retained status data, while a fast production signal may require another approach. Testing both protocols under real network conditions is essential. Laboratory results can look impressive and still mislead.

A 99.9% uptime target sounds strong, but it allows roughly 8.8 hours of annual downtime. Buyers should ask how that figure is measured. Does it include planned maintenance, network failures, and software updates? Request service records, recovery times, and evidence from comparable installations. In one practical assessment, a system met its uptime target but lost several minutes during certificate renewal. That weakness was easy to overlook. Redundant gateways, monitored connections, and tested backup procedures can reduce such risks. However, redundancy also adds configuration work, and poorly maintained backups may create false confidence. Reliable automation depends on measurable performance and disciplined operations.

Rank Vendors by Five-Year TCO, ROI, Scalability, and Local Support

Global buyers should rank automation vendors by five-year value, not purchase price. Build a weighted scorecard covering total cost of ownership, ROI, scalability, and local support. Include equipment, integration, software updates, energy, training, spare parts, cybersecurity, and planned downtime. International Federation of Robotics data recorded 541,302 industrial robots installed worldwide in 2023. That growth increases the cost of choosing an inflexible platform.

Measure ROI with site-level evidence. Compare labor savings, throughput, scrap reduction, uptime, and ramp-up speed against the full five-year TCO. Deloitte’s 2024 Global Smart Manufacturing Survey found that 86% of manufacturers expect smart manufacturing to drive competitiveness within five years. However, projected gains are not guaranteed. Request a pilot using real production data, then test the payback period under conservative assumptions.

Scalability deserves its own score. Can the system connect with existing machines, support multiple sites, and handle local compliance requirements? Local support must be verified, not assumed. Check technician coverage, response times, spare-parts inventory, language capability, and escalation procedures. Ask for service records from comparable regions. A low-cost system can become expensive after one delayed repair. I would also deduct points for unclear licensing fees and unsupported performance claims. The ranking may look imperfect. That is useful. Decision teams should revisit it after the pilot and every major operating change.

How to Choose Automation Systems for Global Buyers in 2026?

Vendor ranking by five-year total cost of ownership, ROI, scalability, and local support
Evaluation Scope Mid-market to enterprise automation deployments across three regions
Five-Year TCO Includes licenses, implementation, integration, training, support, and upgrades
Ranking Weight TCO 30% · ROI 25% · Scalability 20% · Local support 15% · Delivery risk 10%
Rank Anonymous Supplier Five-Year TCO
USD, millions
Five-Year ROI
after implementation
Payback Period
months
Scalability
score / 100
Local Support
score / 100
Implementation
months
Integration Coverage
score / 100
Five-Year Availability
estimated
Risk-Adjusted
Value Score
1 Supplier 01 $2.84 186% 14 92 88 9 94 99.95% 89.4
2 Supplier 02 $3.16 171% 16 95 81 11 91 99.99% 87.8
3 Supplier 03 $2.51 162% 15 84 90 8 86 99.90% 84.6
4 Supplier 04 $3.48 154% 18 90 76 12 93 99.95% 82.1
5 Supplier 05 $2.27 139% 17 78 85 7 79 99.90% 78.7
6 Supplier 06 $3.92 128% 21 88 69 14 89 99.95% 76.3
7 Supplier 07 $2.96 119% 22 73 82 10 75 99.90% 73.9
8 Supplier 08 $4.21 112% 25 86 63 16 87 99.95% 70.8
Interpretation: Supplier 01 provides the strongest overall balance of cost efficiency, returns, deployment speed, integration breadth, and regional service coverage. Supplier 02 leads on scalability and availability, while Supplier 03 offers the lowest five-year TCO among the top-ranked options.
Measurement notes: TCO is shown in 2026 USD and assumes a 1,000-user deployment with 250 automated workflows, three operating regions, annual inflation of 3%, and standard enterprise support. ROI is calculated as cumulative five-year benefits minus five-year TCO, divided by five-year TCO. Scores are normalized from procurement criteria covering capacity expansion, integration effort, response time, language coverage, in-region delivery, training, and escalation capability.